How to fix Runtime.Enable CDP detection of Puppeteer, Playwright and other automation libraries?
It's a pretty old trick to detect open devtools or CDP which was used by Cloudflare, DataDome and many other anti-bot companies for at least a couple of years, but it just became pretty public quite recently. The main source is a blog post on June 13th 2024 at DataDome website from well-known bot researcher Antoine Vastel who sheds light on this technique. You can read the whole post here: How New Headless Chrome & the CDP Signal Are Impacting Bot Detection
What's the idea behind this technique?
In two words, the issue is as follows - all popular automation libraries such as puppeteer, playwright and selenium use CDP as a foundation to communicate with the browser. Also, they all use CDP command Runtime.Enable, which is really important as it allows getting events from the browser from the Runtime domain.
These events are crucial because they allow the library to discover ExecutionContextId of all the frames (pages, workers, etc) of the browser.
These ids are crucial when you want to run some JS code inside the page, and basically 95% of all automated actions are using Page.evaluate in some way.
When the Runtime.Enable command is used, the browser will also emit a Runtime.consoleAPICalled event and it causes some special behavior that could be detected with just a few lines of JS on the page.
Is it really used by anti-bot companies?
It seems like it's heavily used these days. We found some websites that are heavily protected by Cloudflare turnstile and DataDome anti-bot solutions, where major automation libraries fail (meaning they see CAPTCHA instantly after the page is loaded) even when running on a real computer with a perfect residential IP.
Then we tried to disable Runtime.Enable in playwright and puppeteer libraries, and the captcha request disappeared with all the same other conditions.
We tried this experiment on multiple websites, different computers and browsers. The behavior is quite consistent, so the only conclusion we can make is that this CDP detection technique is really used by these big companies, and probably all others have it in their anti-bot arsenal, too, as it's just 5 lines of JS code and it gives quite reliable results.
Where to test this leak?
There are multiple websites that you can open in your automation tool to see if CDP is detected. Here are some of them:
https://kaliiiiiiiiii.github.io/brotector/
https://deviceandbrowserinfo.com/are_you_a_bot
https://hmaker.github.io/selenium-detector/
Also, we made our own rebrowser-bot-detector which includes this detection test as well.
How about using DevTools as a normal user?
It's true that this technique also triggers with a normal browser with open devtools. Some people suggest using the --auto-open-devtools-for-tabs switch to have devtools open for all pages causing false positives for this test. But there are two issues.
1. They can use some tricks with timing to distinguish CDP from DevTools, see example of code here:
https://github.com/kaliiiiiiiiii/brotector/blob/master/brotector.js#L143
2. How many typical people have DevTools open in their browser? It's probably less than 0.1% meaning that this feature puts you in quite a small bucket of fingerprinting characteristics, so it's a strong signal to any system that you're not quite typical and maybe you deserve to work on some CAPTCHAs.
How about a custom built Chrome?
Some people report that they had some success with custom-built Chromium. Yeah, that's true, you can take Chromium source, basically comment out code to prevent Runtime.consoleAPICalled event at all, and this will probably fix the problem. But there will be another issue: you will have a custom-built Chromium which is quite different from a typical Chrome which leads to many unique fingerprinting metrics that you will have to take care of. And this is a quite complicated topic which requires constant engagement in a cat and mouse game.
Maybe we could override console object?
The detection technique is based on leveraging the console object. We can use the Page.addScriptToEvaluateOnNewDocument command to inject some JS logic that will be performed on every page of the browser before all other code. In this logic, we can modify the console object in some way to prevent this CDP leak.
Some people suggested using something like this:
console.debug = console.log = {}
And, it actually works on multiple test pages. But the truth is that reality is a bit more complicated, DataDome and other major players most likely won't fall for this fix as it's quite easy to detect.
We could also use Proxy object. According to ES6 Proxies documentation:
It is impossible to determine whether an object is a proxy or not (transparent virtualization).
The basic idea of the script that we pass into Page.addScriptToEvaluateOnNewDocument is as follows:
const handler = {
  get(target, propKey, receiver) {
    return (...args) => {
      if ([
          'debug',
          'error',
          'info',
          'log',
          'warn',
        ].includes(propKey)) {
        // ignore these methods
        return
      }
      // pass to the original console
      return Reflect.get(target, propKey, receiver)
    }
  },
}
window.console = new Proxy(origConsole, handler)
So, in theory, it shouldn't be detectable that we modified the console object.
But! It doesn't work. There are some sophisticated techniques that will be able to check for Proxy or Object.defineProperty(). In our tests, Cloudflare and DataDome weren't affected by the changed console object. They might be able to detect Proxy or watch some side effects.
How to fix it then?
Unfortunately, some aspects of automation libraries or browser behavior cannot be adjusted through settings or command-line switches. Therefore, we fix these issues by patching the library's source code. While this approach is fragile and may break as the libraries' source code changes over time, the goal is to maintain this repo with community help to keep the patches up to date.
We made a patch that fix puppeteer and playwright source code.
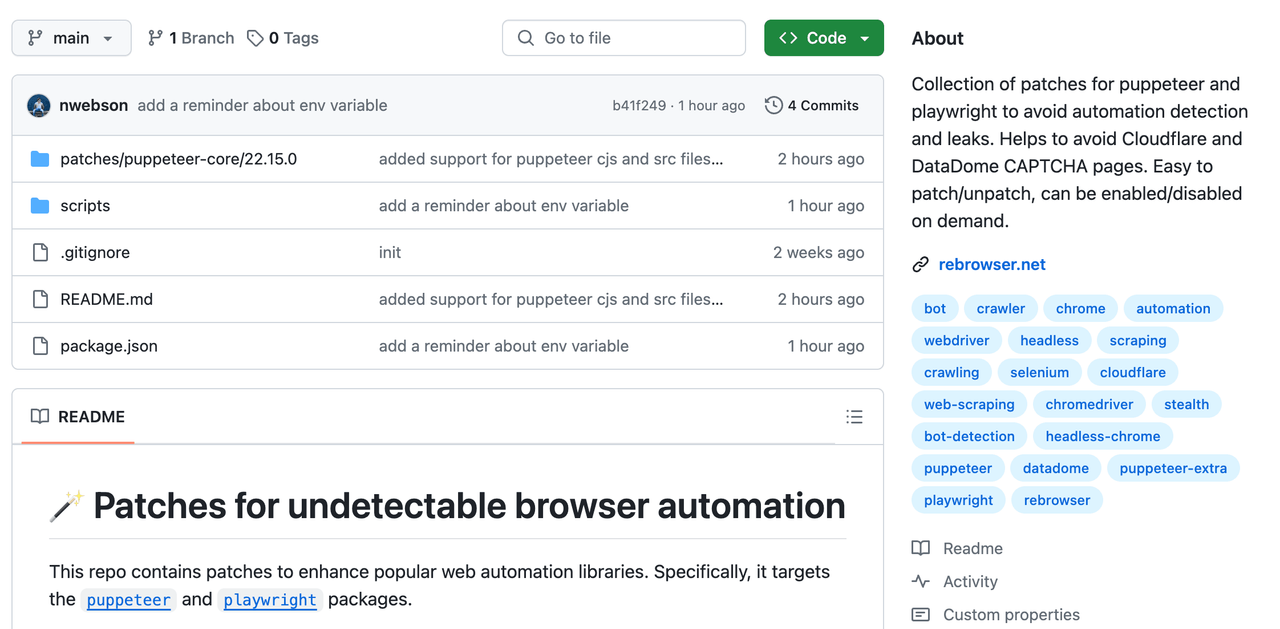
This patch is developer-friendly and could be applied with just one command. Our fix disables the automatic Runtime.Enable command on every frame. Instead, we manually create contexts (read more about isolated context) with unknown IDs when a frame is created. Then, when code needs to be executed, we have implemented two approaches to get the context ID. You can choose which one to use.
1. Create a new isolated context via Page.createIsolatedWorld and save its ID from the CDP response.
🟢 Pros: All your code will be executed in a separate isolated world, preventing page scripts from detecting your changes via MutationObserver. For more details, see the execution-monitor test.
🔴 Cons: You won't be able to access main context variables and code. While this is necessary for some use cases, the isolated context generally works fine for most scenarios. Also, web workers don't allow creating new worlds, so you can't execute your code inside a worker. This is a niche use case but may matter in some situations. There is a workaround for this issue, read our other blog post How to Access Main Context Objects from Isolated Context in Puppeteer & Playwright.
2. Call Runtime.Enable and then immediately call Runtime.Disable.
This triggers Runtime.executionContextCreated events, allowing us to catch the proper context ID.
🟢 Pros: You will have full access to the main context.
🔴 Cons: There's a slight chance that during this short timeframe, the page will call code that leads to the leak. The risk is low, as detection code is usually called during specific actions like CAPTCHA pages or login/registration forms, typically right after the page loads. Your business logic is usually called a bit later.
🎉 Our tests show that both approaches are currently undetectable by Cloudflare or DataDome.
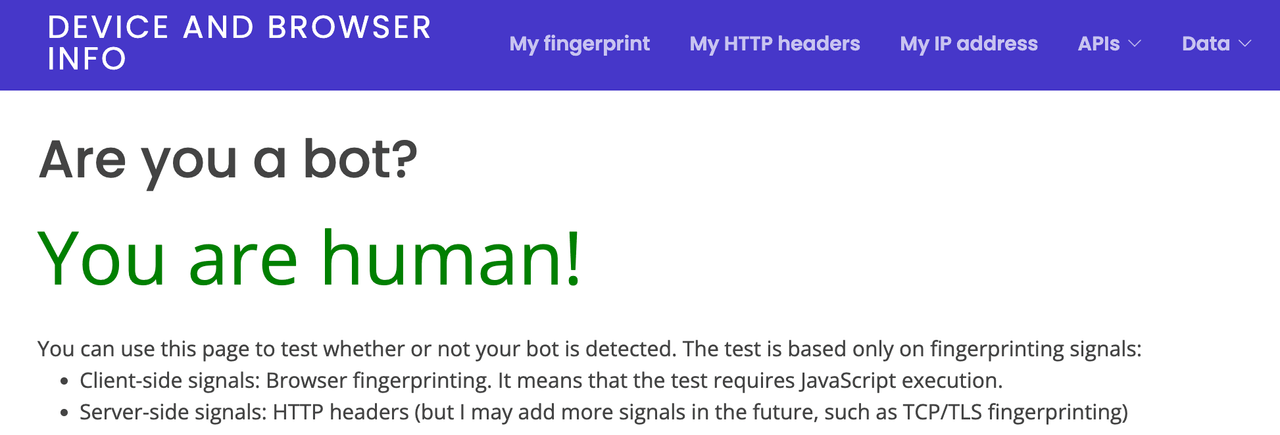
You can read more and try it on github: https://github.com/rebrowser/rebrowser-patches
We're actively watching the issues section for any reports from the community.
Also, don't forget to ⭐️ star this repo, we're going to add more interesting patches and fixes to it sometime soon.
How to debug any exposure to the leak?
As it's done via Runtime.consoleAPICalled event, you can listen for this event explicitly, to see if there were any events emitted during your code execution. If not - it's safe to state that there was no leak detection code executed during that period. If you see some events - it could be some side events from other scripts, you need to look deeper into it.
You can enable these event listeners via code:
page._client.on('Runtime.consoleAPICalled', (message) => { console.log('Runtime.consoleAPICalled:', message)})
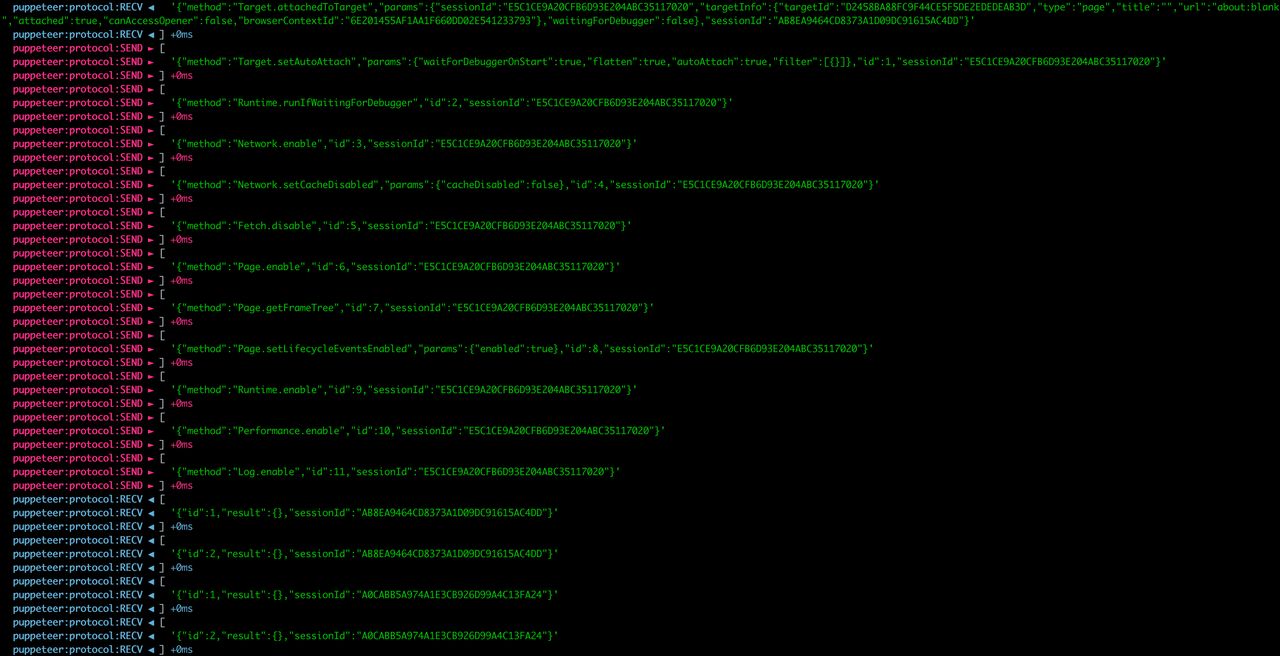
or just enable debug flag to see all CDP events (very useful to understand how it works internally).
DEBUG="puppeteer:*" node script.js
Wait, what is Rebrowser?
Remember, in this game, the less you manipulate the browser stuff via JS injections is better, because there are ways to detect that internal objects such as console, navigator and others were affected. It's tricky, but it's always a cat-mouse game.
Our cloud browsers are undetectable, and also have a feature that will notify you if your library uses the Runtime.Enable command or has some other red flags that could be improved.
Create an account today to get invited to test our bleeding-edge platform to push your automation business to the next level.
If you have any ideas, thoughts, questions, feel free to reach out to our team by email or on github.


